
Zimbabwe in 10 numbers
 AFP
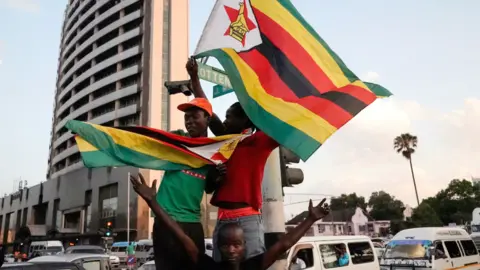
AFPZimbabwe’s President Robert Mugabe resigned last year after almost four decades in power. Now, the country is approaching its first post-Mugabe election, with his successor Emmerson Mnangagwa and MDC Alliance candidate Nelson Chamisa the two front-runners in a field of 23 candidates.
Here are 10 numbers that will help you understand how the country got to where it is now.


2 = the tally of leaders in the last 38 years
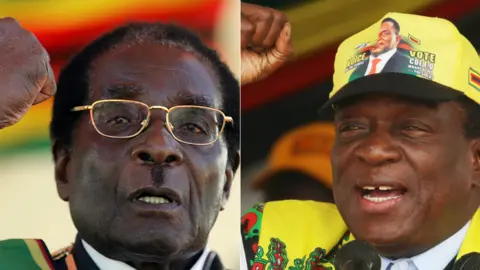
Robert Mugabe, who led the country’s liberation movement, was in power from independence in 1980 until he was ousted in November last year at the age of 93. His years in office, first as prime minister until the switch to a presidential system in 1987, were marked by economic turmoil and the crushing of dissent.
 AFP/Reuters
Emmerson Mnangagwa is his successor – nicknamed the “crocodile” because of political cunning. Once a Mugabe loyalist, he promises to revive the shattered economy and hopes to win elections on 30 July to legitimise his presidency.
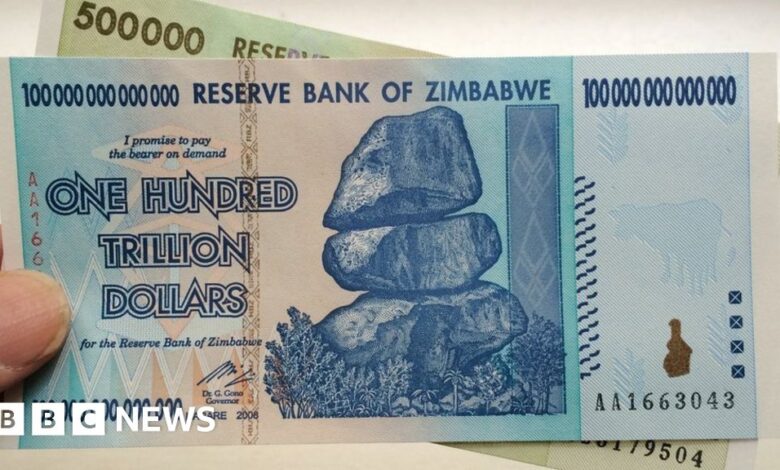
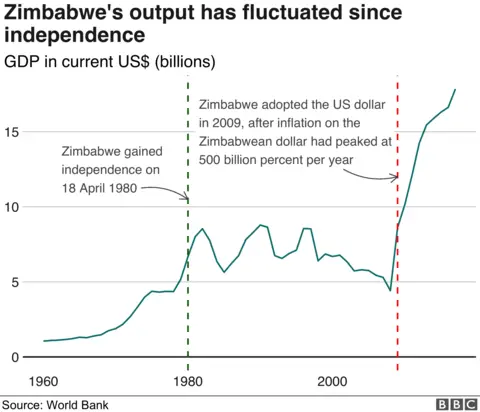
231 million % = inflation in July 2008
Zimbabwe’s economy has struggled since a controversial land reform programme was introduced in 2000.
The programme that saw white-owned farms redistributed to landless black Zimbabweans – and those with good political connections – led to sharp falls in production.
As the country’s central bank printed money to try to get out of the crisis, rampant inflation took hold.
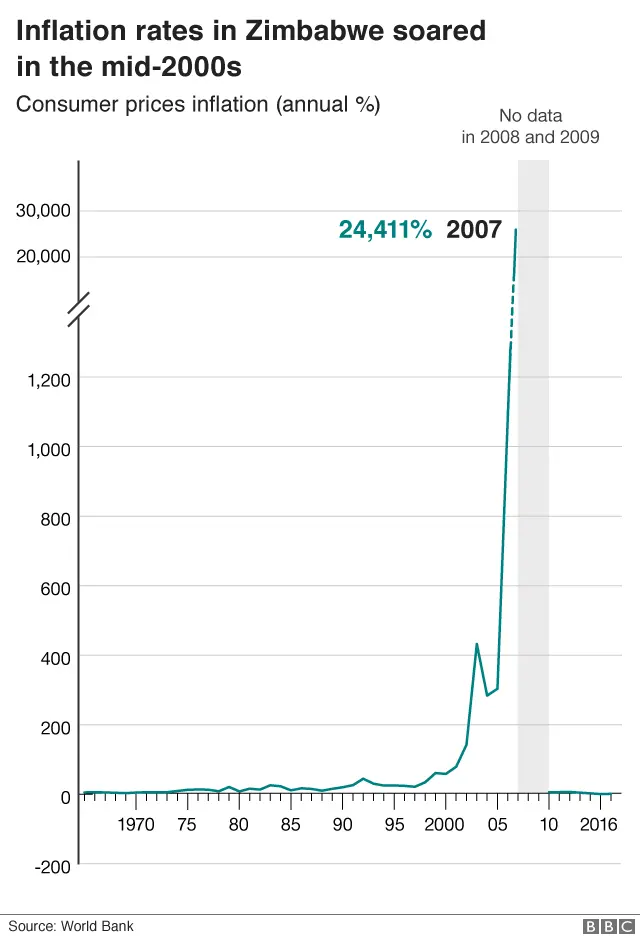
Although the World Bank does not have figures for 2008 and 2009, numbers from Zimbabwe’s central bank showed annual inflation reached 231 million % in July 2008. Officials gave up reporting monthly statistics when it peaked at just under 80 billion % in mid-November 2008.
The country was forced to abandon its own currency a year later at a rate of Z$35 quadrillion to US$1.
More on post-Mugabe Zimbabwe:
$16.3bn = GDP in 2016
A brief period of recovery between 2009 and 2012 has now faltered and the economy faces serious challenges, says the World Bank. Growth has slowed sharply from an average 8% from 2009 to 2012, caused by shifts in trade and a series of major droughts.
Mr Mugabe always blamed Zimbabwe’s economic problems on a plot by Western countries, led by the UK, to oust him because of his seizure of white-owned farms.
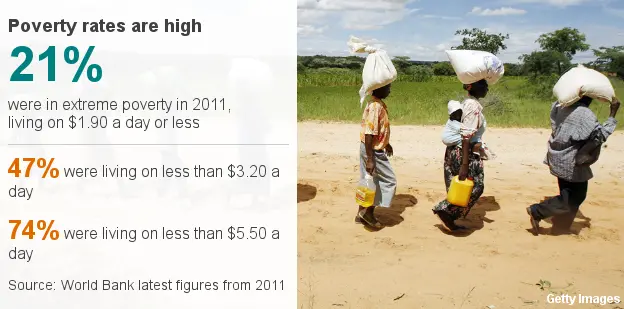
74% = the population living on less than $5.50 a day
The country’s political and economic crises have resulted in high poverty rates.
Extreme poverty, estimated to have fallen from 2009 to 2014, is now projected to have risen again substantially.
90% = one estimate of the unemployment rate
Estimates of the country’s unemployment levels vary wildly.
 AFP
AFPHowever, the World Bank’s definition only covers those actively seeking work. Many of those not counted may not seek a job despite wanting one because they “view job opportunities as limited, or because they have restricted labour mobility, or face discrimination, or structural, social or cultural barriers”.
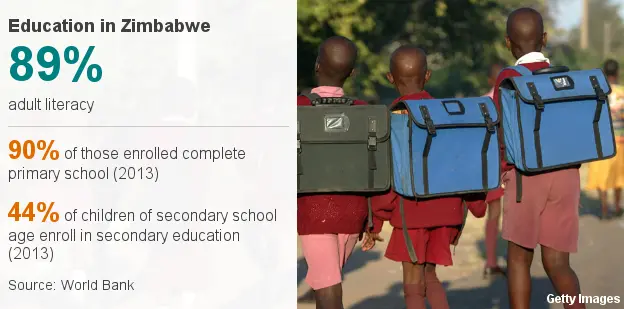
89% = adult literacy rate
Thanks to large investments in education since independence, Zimbabwe has one of the highest adult literacy rates in Africa, with 89% of the adult population literate, according to World Bank data from 2014.
Globally, the literacy rate stood at 86% in 2016, while in sub-Saharan Africa it was 64%.
13.5% = the adult prevalence rate of HIV/Aids
Zimbabwe has the sixth highest HIV prevalence rate in sub-Saharan Africa, with 1.3 million people living with HIV in 2016, according to UNAids.
However, after a peak in 1997, rates are declining.
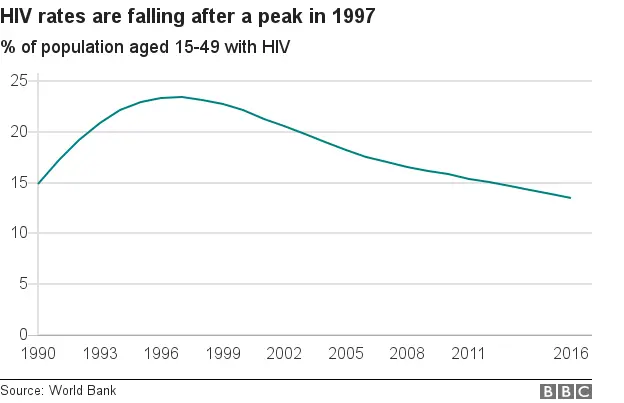
According to the UN, this is a result of successful campaigns encouraging condom use as well as programmes preventing the transmission of infection from mother to child. Treatment and support services have also improved.
61 = the life expectancy at birth
Life expectancy fell in the 1990s, with the HIV/Aids epidemic a major killer. It dropped from a high of just under 61 years in 1986 to 44.1 years in 2003.
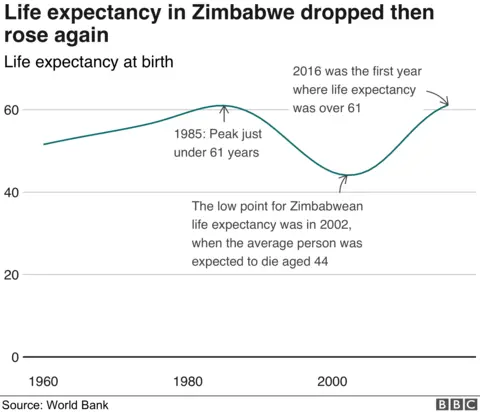
It is now steadily improving again, but with unemployment and poverty endemic and HIV/Aids rates still high, it remained at just 60 in 2015, according to World Bank data.
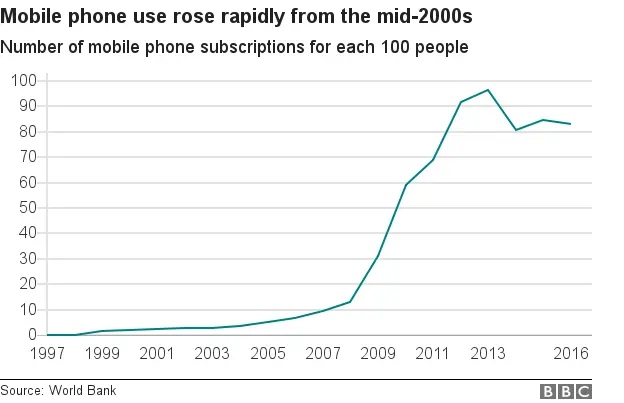
81 = the number of mobile subscriptions per 100 people
Mobile devices are the leading communication tool for Zimbabweans.
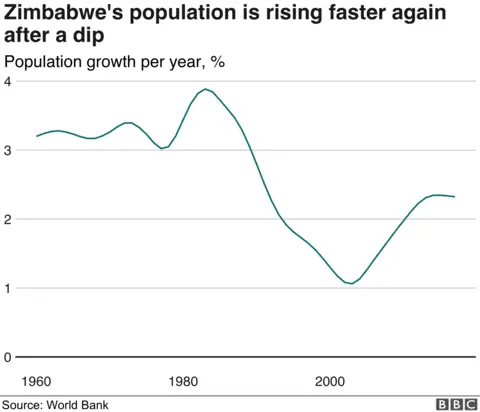
16.7 million = the current population
After a growth spurt after independence in 1980, a decline in birth rates and a rise in death rates saw population growth slide downwards.
With high outward migration rates also high, the population has not recovered its post-independence growth.
Written and produced by Lucy Rodgers.
Source link